MPLAB® X Integrated Development Environment (IDE)
MPLAB X Integrated Development Environment (IDE) is an expandable, highly configurable software program that incorporates powerful tools to help you discover, configure, develop, debug and qualify embedded designs for most of our microcontrollers and digital signal controllers. MPLAB X IDE works seamlessly with the MPLAB development ecosystem of software and tools, many of which are completely free.

MPLAB X IDE brings a host of features to help you quickly debug your projects and minimize your development time. Some newer features include:
- Data Visualizer: No need to purchase extra visualizations tools since real-time streaming data can be viewed in Data Visualizer
- I/O View: Pin states can be verified and manipulated with I/O View for fast hardware verification
- Helpful Design Resources: Save time with useful links to software libraries, datasheets and user guides that are provided automatically
- Easy to Use: Register and bit definitions are now just a click away
- Includes the MPLAB Integrated Programming Environment (IPE) for production-level programming
Please refer to this link for information about our security advisories.
MPLAB for VS Code®
Did you know that MPLAB X IDE projects are now supported in Microsoft® Visual Studio Code (VS Code®) along with MPLAB Code Configurator, MPLAB Data Visualizer and more MPLAB Tools? You can now use your favorite MPLAB Tools in the world’s most popular code editor. Visit our MPLAB for VS Code page to learn more.
MPLAB X IDE Legacy Tool Support
MPLAB X IDE v6.20 is the final version with support for the PICkit™ 3 programmer, MPLAB ICD 3 and MPLAB REAL ICE™ in-circuit emulator. To access new features that come with the next release of the IDE and ensure compatibility with future IDE releases, we recommend upgrading to our latest development tools: MPLAB PICkit 5 In-Circuit Programmer, MPLAB ICD 5 In-Circuit Debugger and MPLAB ICE 4 In-Circuit Emulator.
Discover your options and learn more in this Q&A article on our blog.
- Downloads
- Features
- Documentation
- Debug Features
MPLAB X IDE v6.30 Released
We recommend using MPLAB for Microsoft® Visual Studio Code (VS Code®) for both new and existing projects. You can find information and resources for an easy transition here.
Version 6.30 of MPLAB X IDE covers the following:
- Improvements in tool communication
- Information about MPLAB for VS Code
- Bug fixes
For the latest documentation, see the user's guide.
Notes About MPLAB X IDE
- MPLAB X IDE only supports computers with processors based on Intel® 64 or AMD® 64-bit architectures or Arm®-based Apple® silicon
- Windows® 11 is supported by MPLAB X IDE v6.05 and later
- After you have installed MPLAB X IDE, go to Tools > Plugins regularly to check for updates and bug fixes
- For MPLAB X IDE v6.10, install the five plug-ins that are suggested in the popup notification. These plug-ins will enable the MPLAB PICkit™ 3 and MPLAB ICD 3 In-Circuit Debuggers/Programmers and onboard debugging for certain evaluation board boards and fix connectivity issues. For details, see the "ReadMe for MPLAB X IDE" under Help > Release Notes
MPLAB X IDE Features
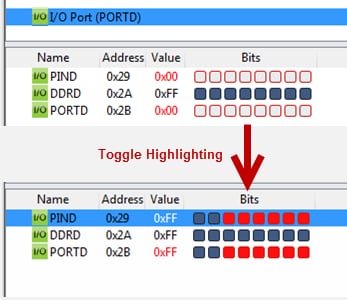
| I/O View | |
I/O View gives a register overview of the target device for the current project, serving as a quick reference during design. When debugging, a live view of the registers is displayed and bits can be directly manipulated for fast hardware verification.
| |
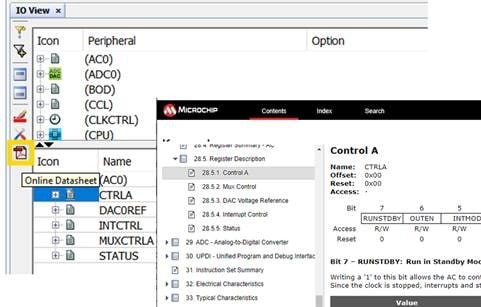
| One-Click Access to Data Sheet Content as Online Context Help | |
You can access the data sheet content as online context help in a browser. When you see the Online Data Sheet button is active, you can click on it and get online context help for the selected register. Watch this video to see a demonstration of this feature.The online data sheet is available for select MCU devices, including newer AVR®, SAM and 8-bit PIC® devices when a register is selected.
| |
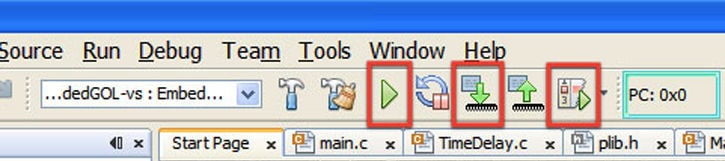
| One-Click Make, Program, Debug/Execute | |
Unlike other IDEs where you need to build, connect to the hardware tool, program the target and then start your debug session, all these functions are offered in one action button. Run, Program, or Debug Run starts ‘Make’, which will check for changes and build any relevant updates, connect to the tool program the images and either start a debug session or start an execution of the programmed image. If you prefer, you can choose to perform these functions individually.
| |
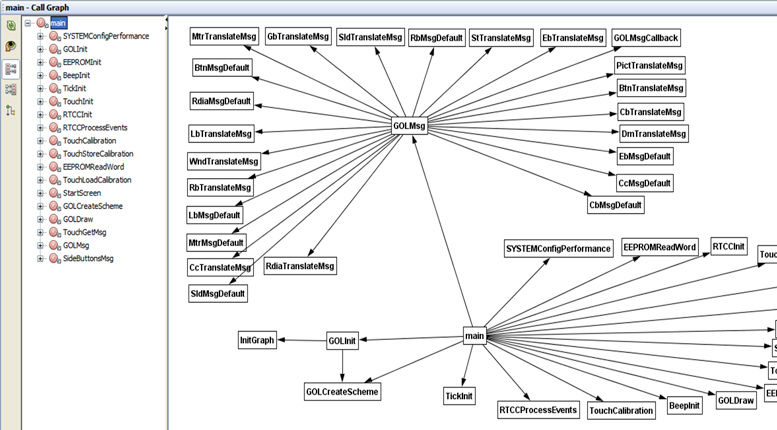
| Call Graph for Navigating Complex Codes | |
The Call Graph provides a static call tree of all functions called from other functions. It can also be exported to a Portable Network Graphics (PNG) image. This makes it easier to navigate your code or understand a colleague's code.
| |
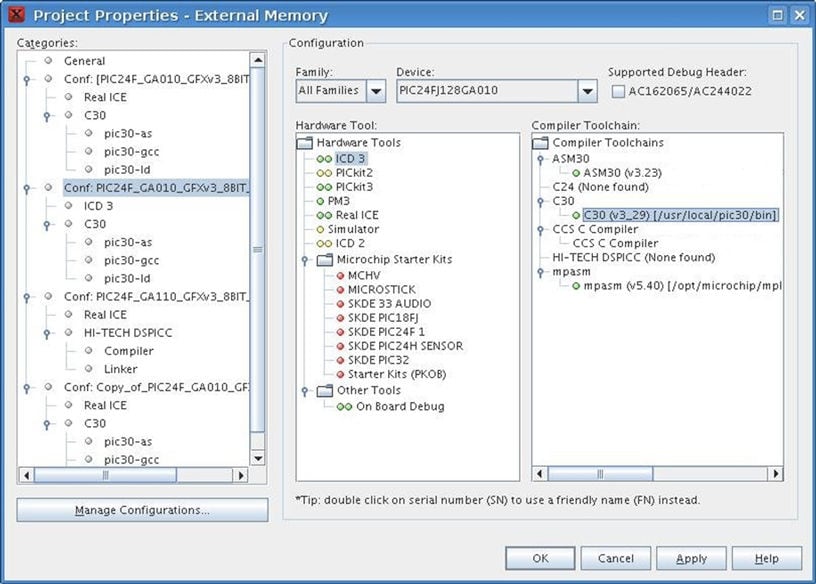
| Multiple Configurations Within Your Projects | |
A single project can build the same set of source files in many different ways. Each configuration has its own compiler options, compiler, hardware tool and target device.
| |
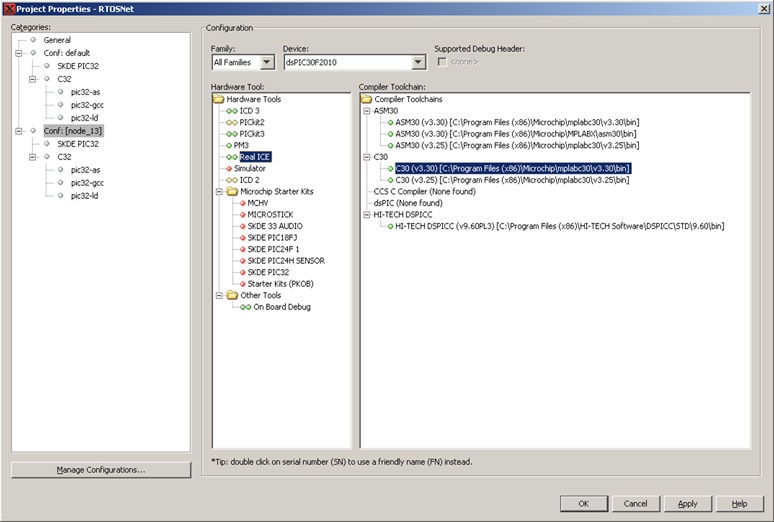
| Support for Multiple Versions of the Same Compiler | |
You can have as many versions of a compiler installed as you wish. Each is identified by its own version. For any project, you can select the specific version of your choice. This enables you to use more than one instance of a compiler within the IDE at the same time. Project configurations can be set to use an older version while trying a new release of a compiler.
| |
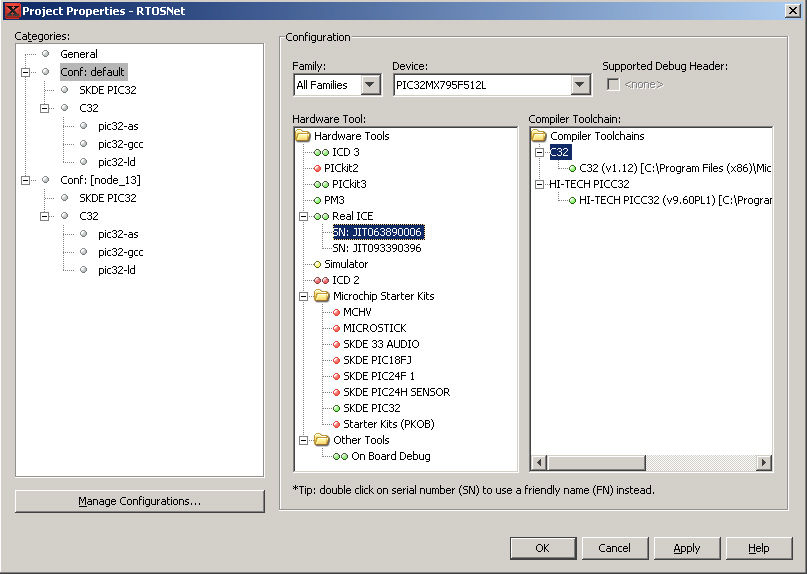
| Support for Multiple Debug Tools of the Same Type | |
You can have multiple debug tools connected to the computer at the same time. You can select any tool you desire for a specific project or configuration within a project (example: Programmer and Simulator in their own configurations). You can also debug more than one target at the same time using just one installation of MPLAB X IDE.
| |
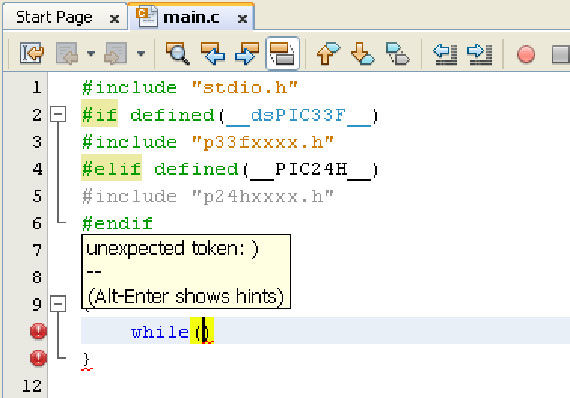
| Live Parsing | |
Live parsing will flag something that the C parser doesn't recogize while you are typing in your code, which frequently allows you to fix your code even before you compile it.
| |
| Import Existing MPLAB 8 IDE Projects and Use Either IDE for the Same Source | |
You can import an existing MPLAB 8 project and develop the code from within either IDE. The same compiler and same debug tools are used, so the code is still as production worthy as always. This flexibility allows you to use MPLAB X IDE without affecting your MPLAB 8 project.
| |
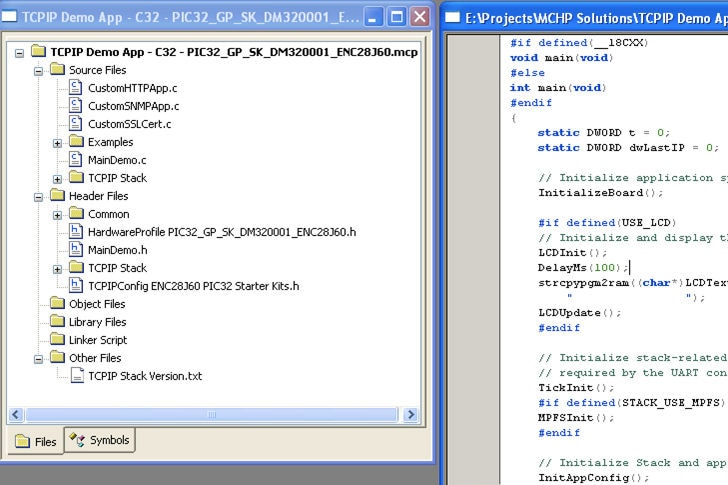
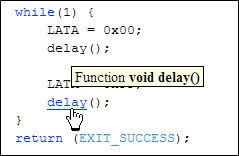
| Hyperlinks for Fast Navigation to Declarations and Includes | |
View the declaration for a function, variable, macro, or include statement by using the CTRL key and mouse over. Clicking on the hyperlink will take you right to the source of declaration. Alternatively, you can right click on it and choose Navigate → Go to Declaration from the context menu to jump to its declaration.
| |
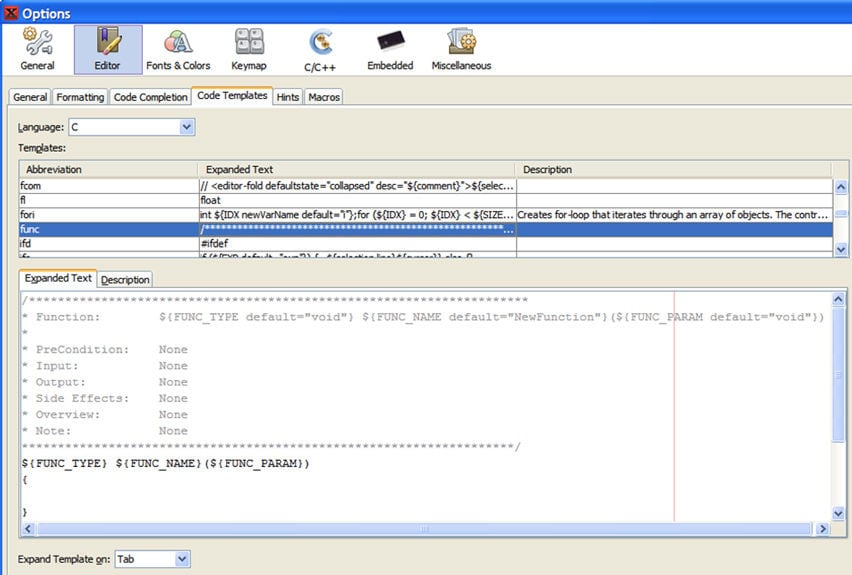
| Live Code Templates | |
Within the IDE there are many code templates that can be accessed using a couple of letters then tab (or specified key). You can create your own templates, even live templates, so that when you enter values into the template area, other areas of code are also populated. For example the 'func' active code template is shown below. As you enter parameters in the comments to document the function, the real function is also populated.
| |
| Enter File Code Templates with License Headers or Template Code | |
| You can select from a template file whenever you create a new file to add source code. | |
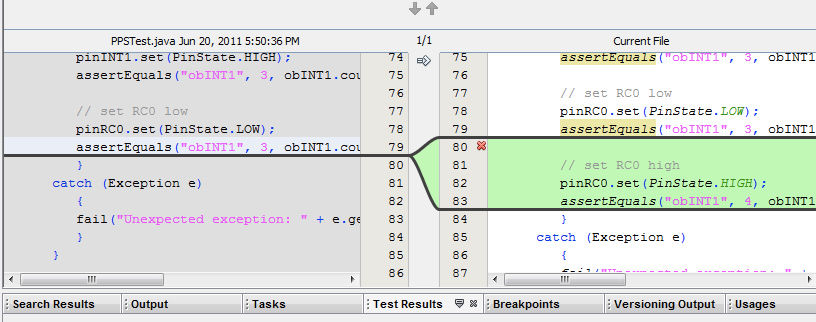
| Track Changes Within Your Own System Using Local History | |
If you are unsure of what changes you made to the software since the last version control update, you can use the Local History utility to visualize the changes that were made. This feature is very useful for backtracking.
| |
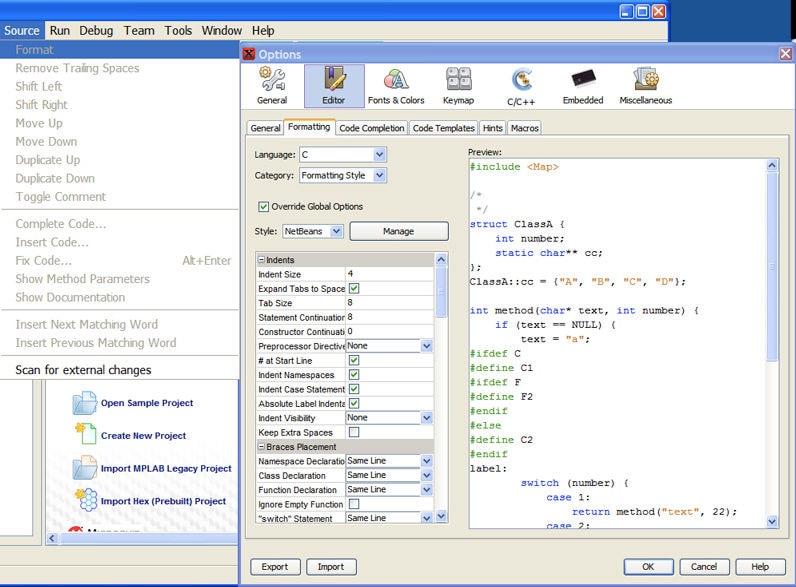
| Configure Your Own Code Format Style | |
You or your company can set up a code format standard to be used within the editor. Just select the file to format the code in and menu Source >/Format to reapply the template to your source code.
| |
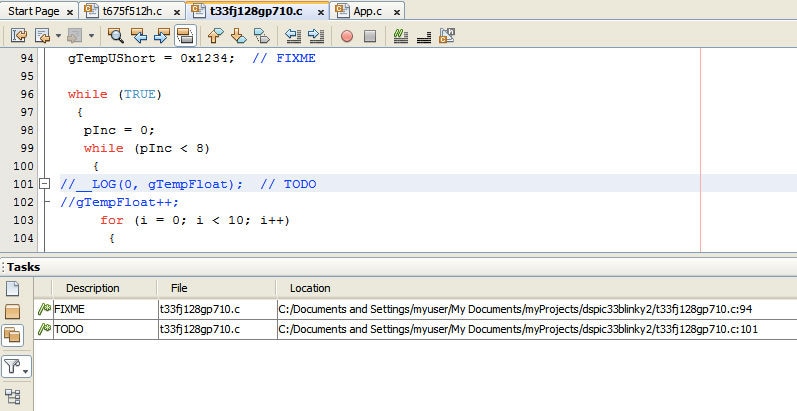
| Tasks Window to Keep Track of Loose Ends in Your Code | |
The Tasks operation automatically scans your code and lists commented lines containing words such as "TODO" or "FIXME" (these words can be customized under Options). Tasks provide a convenient way to keep track of important items you feel need addressing.
| |
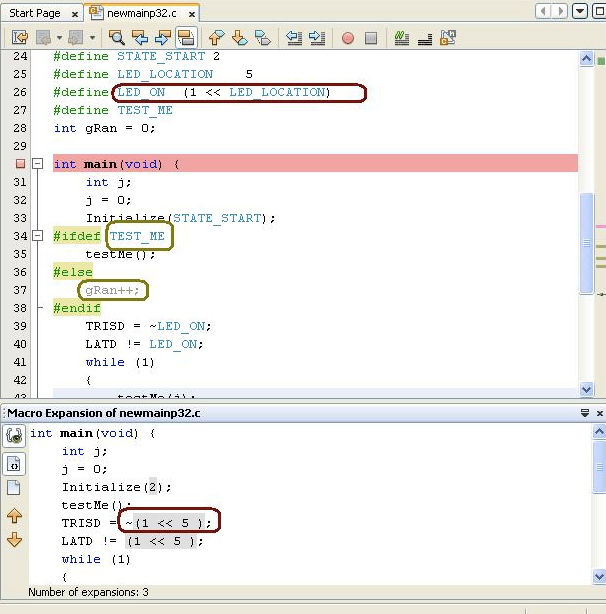
| Show Macro Expansions | |
Macros are incredibly useful, but sometimes they can have unexpected values if they are conditionally defined. This window allows you to see what the compiler will consume after the preprocessor is done. With the expansion view, you see exactly what value they expand to. Blocks of code that are not to be compiled are omitted in the view. In the editor window, MPLAB X IDE shows you all the #ifdef/#endif blocks. It uses the comment color (grey by default) to show you sections that will not be included.
| |
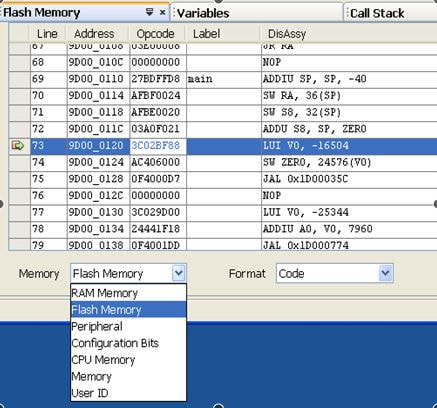
| Configurable Memory Views | |
You can change any memory view to look at any type of memory. Formats for those views are also selectable from the dropdowns. This provides a quick view of a change without going through the menus.
| |
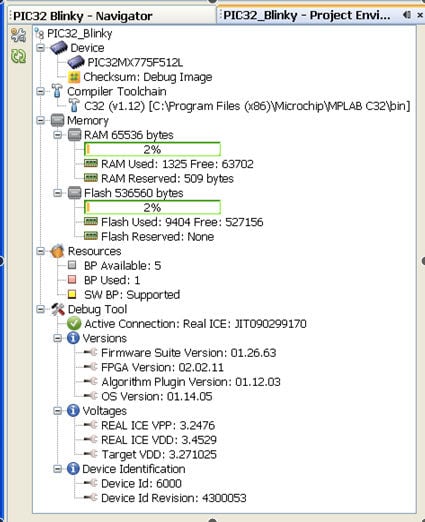
| Project Status Window | |
Do you need one place to summarize your project? For convenience there is a single window that gathers all the relevant project information and its environment. It shows Device name, Debug Tool, Language Build Tool, and Connection state. The Memory section shows Total, Used and Reserved by Debug Tool for RAM and Flash memory. Checksum and Breakpoint (silicon resource) status is also shown. The Debug tool provides additional status for Device ID, firmware versions and voltages.
| |
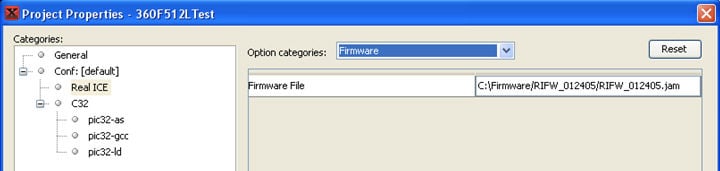
| Attach a Specific Debugger Tool Firmware Version to a Project | |
With this feature, you’ll never have to worry about which firmware version you were using. MPLAB X IDE will remember it and automatically restore it to the correct version when you connect to the debugger. Just set it and forget it.
| |
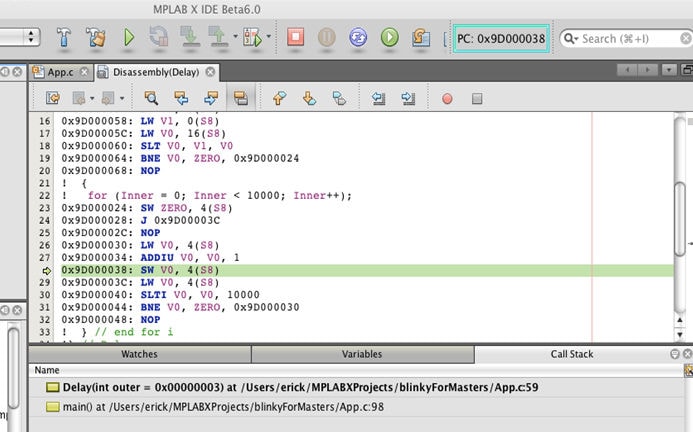
| Two Types of Disassembly Windows | |
Available only during a debug session and accessed through the Window >/ Debugging menu, this Disassembly window shows the disassembled memory of the high-level language function in the scope of the current execution point of the debugger. It is extremely useful for debugging program execution at the assembly level. The Disassembly listing window is similar to the one provided in MPLAB IDE v8.x. It is available under the Window >/ Output menu. This window shows the disassembled code generated by the compiler for the current project. It interleaves the disassembled code with the original high-level language source code so it is possible to see what the compiler generates for each line of source code in the project. A project must be built with debugging information, since the display depends upon the debugging line table within the built project to display data.
| |
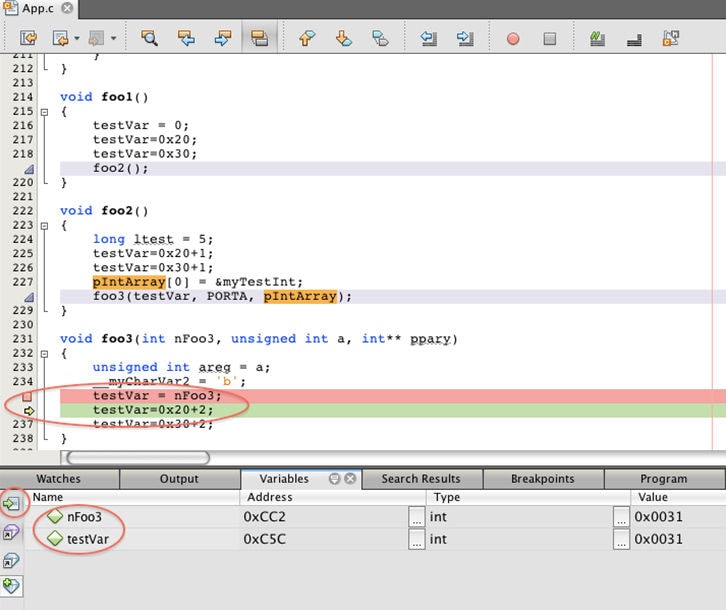
| Software Call Stack Window with Function Arguments | |
| Use the Variables and Call Stack windows together to browse local variable history of each function in the call chain. Hint: The Variables window is docked at the bottom of the output pane to allow simultaneous interaction and display of the local variables with the selected function in the Call Stack window. | |
| Focused Modes of the Variables Display | |
The Variables window is configured to show only variables used near the program counter location (cursor position). In this mode, note that global variables used in the scope of the function can be displayed as well as local variables.
| |
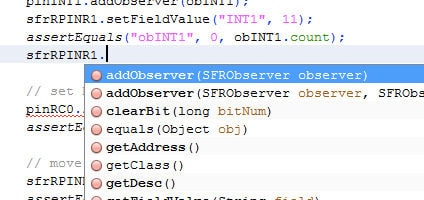
| Auto-Completion | |
Save time entering programs and ensure correctness using the editor’s auto-completion features.
| |
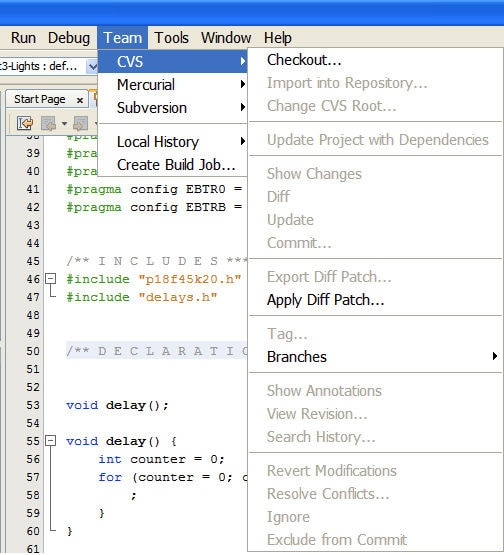
| Built-in Source Code Control | |
There are three flavors of configuration management source control already built into the IDE. Others are provided through the NetBeans community.
| |
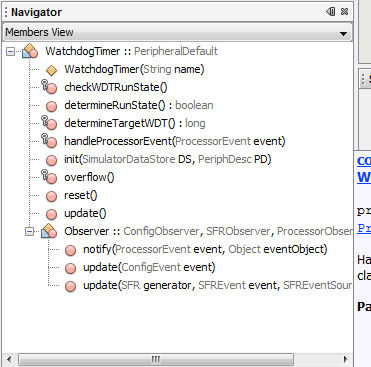
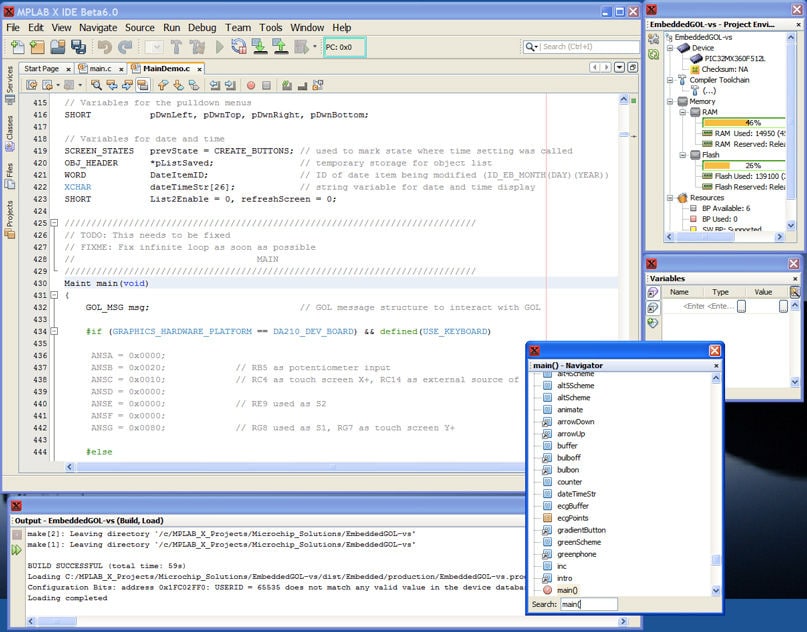
| Navigation Window for Fast, Easy Access to Code | |
Save time navigating to particular locations in large code bases using the Navigation window. Use the context menu to filter out undesired types.
| |
| Fully Customizable Workspace and Multiple Screen Support | |
You can customize the actions in the toolbars, minimize the windows to have them on side bars which will pop out. Undock any editor tab by dragging and dropping it outside the IDE. This will turn into an independent window that will allow you to move onto a second screen.
| |
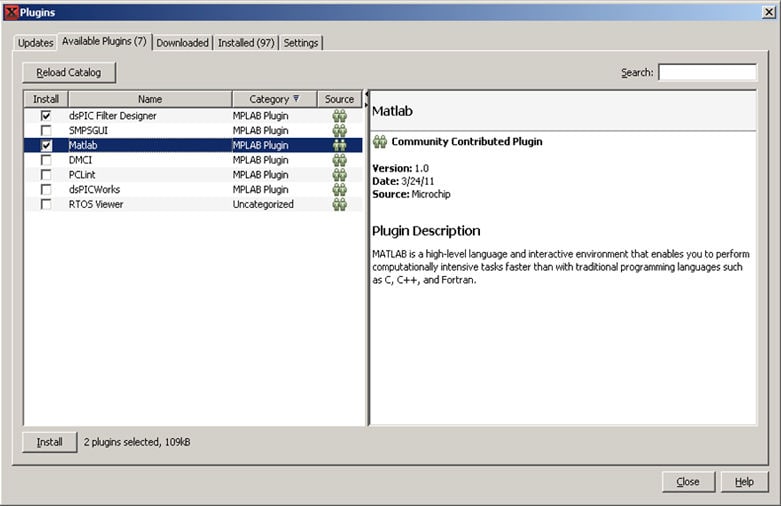
| Extend Functionality with the MPLAB IDE Plug-in Manager | |
You can use the plug-in manager from the tools menu to add, remove or update sets of features for embedded programming, including a wide variety of NetBeans plug-ins. These include Change Case, Rectangular Edit Tools, Adobe Reader, Clear Case Revision Control, plus many more. Visit plugins.netbeans.org/PluginPortal. We host a plug-in portal for plug-ins developed by Microchip.
|
MPLAB Development Ecosystem Tools and Other Resources

MPLAB X IDE CI/CD Wizard
By using a Continuous Integration and Continuous Deployment (CI/CD) system, you can receive feedback quickly in your software development. Quick feedback can help improve the quality and reliability of your code by automating much of the building and testing process.

MPLAB Analysis Tool Suite
MPLAB Analysis Tool Suite is a collection of analysis tools integrated into the MPLAB X IDE. It supports all of our MCU, MPU and CEC devices and offers a code coverage feature and a Motor Industry Software Reliability Association (MISRA®) check in the IDE.
Microchip University
Get free training on our products 24 hours a day, every day. We offer on-demand courses and live sessions on general embedded control topics as well as Microchip, Atmel and Microsemi products. Learn how to improve your business by using our products to their full advantage.
Getting Started with MPLAB® X IDE
Discover the fundamentals of MPLAB X IDE with this “Getting Started: MPLAB X IDE Essentials” playlist. These short but informative videos guide you through installation, interface navigation, beginning a project and more.
Need Some Help?
We are here to support you. Contact our Client Success Team to get assistance with your design.
