Live Chat
Need Help?
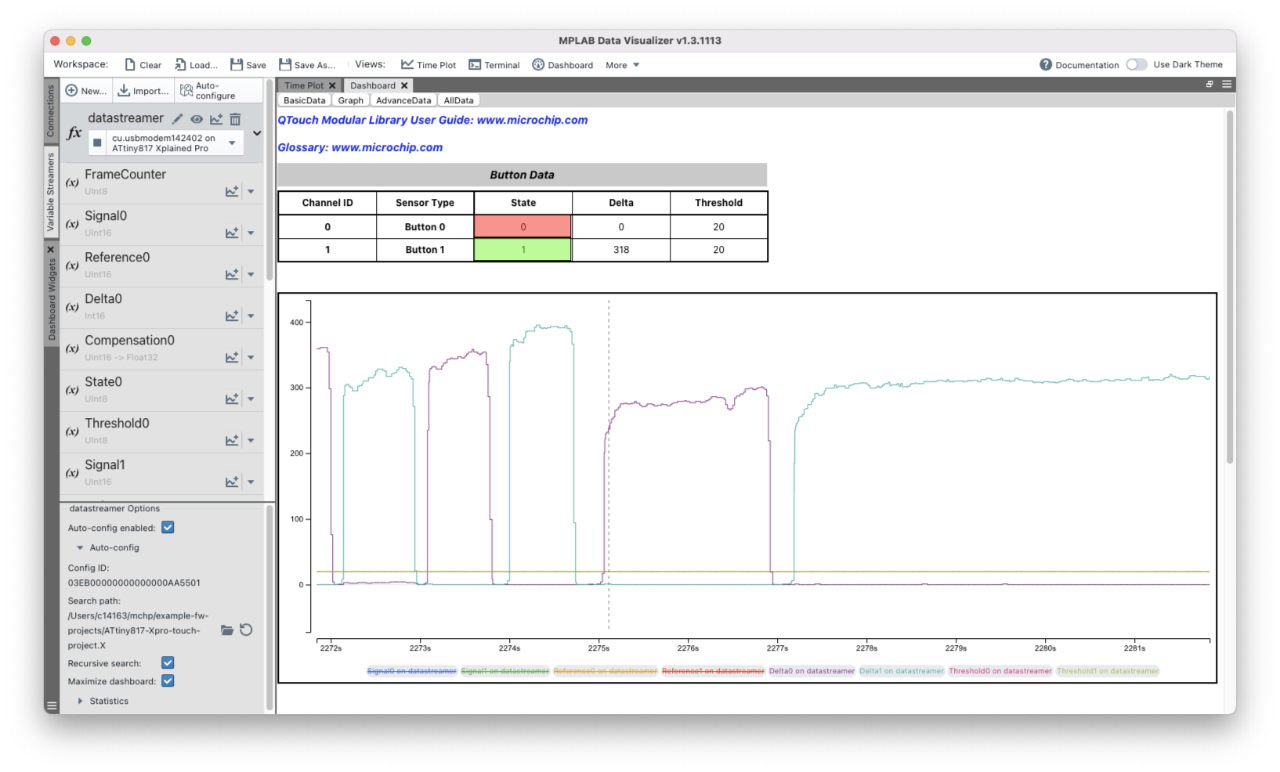
Privacy PolicyTroubleshooting your code's run-time behavior has never been easier. MPLAB® Data Visualizer is a free debugging tool that graphically displays run-time variables in an embedded application. Available with MPLAB Tools for VS Code®,as a plug-in for MPLAB X Integrated Development Environment (IDE), or as a stand-alone debugging tool, it can receive data from various sources such as the Embedded Debugger Data Gateway Interface (DGI) and COM ports. You can also track your application's run-time behavior using a terminal or graph. To get started with visualizing data, check out the Curiosity Nano Development Platform and Xplained Pro Evaluation Kits.
MPLAB Tools for VS Code®
Did you know MPLAB Data Visualizer and more MPLAB Tools are now available in Microsoft® Visual Studio Code (VS Code)? You can now use your favorite MPLAB Tools in the world’s most popular code editor. Visit our MPLAB Tools for VS Code page to learn more.
Key Features
MPLAB Data Visualizer Version 1.6.2606 Released
Version 1.6.2606 of MPLAB Data Visualizer includes several enhancements, including:
- Added support for the X2Cscope protocol, with streaming and watch functions for X2Cscope-enabled targets
- Improved dashboard with new widgets for reading and writing variables for supported protocols
- Enhanced usability with new drag-and-drop interactions for plots, axes and terminal views
- Improved default panel layouts, theming and symbol selection to streamline workflows and improve accessibility
- Resolved reported issues
For more information, please refer to the release notes.
Downloads and Documentation
Need Some Help?
We are here to support you. Contact our Client Success Team to get assistance with your design.

Using the MPLAB® Data Visualizer
In this video, learn about:
- Plotting debug GPIO
- Kit detection
- Plot all pins: add new plot, assign source
- Using cursors to measure a time between two cursors