Overview
This product is no longer available for sale.
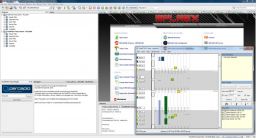
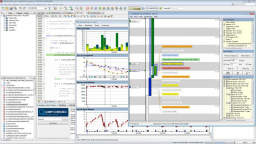
FreeRTOS+Trace for PIC32 Professional is an MPLAB X Plug-in that provides visualization of the run-time behavior of your FreeRTOS software. Now you can see the “big picture” while debugging, through more than 20 high-level, interconnected views that are intuitive to use. The types of views provided in the Professional version are listed in the feature list below. Note that The Standard version (TSW1009) contains a subset of these views.
FreeRTOS+Trace for PIC32 consists of three parts, all included in the installation package:
-A trace recorder library that integrates with FreeRTOS, provided in C source code
-The Trace Export plugin for MPLAB X IDE, which reads the recorder RAM buffer and outputs a trace file
-The PC application for visualizing the trace files. It runs on Microsoft Windows and Linux
For additional information, visit Percepio's FreeRTOS+Trace for PIC32 page or watch the FreeRTOS+Trace for PIC32 video.
- Interrupt trace
- Multiple trace views
- Finder feature
- Maximum trace length
- Kernel object events shown in trace (queues, semaphores, …)
- Highlighting of related event labels
- CPU load graph
- User events shown in trace
- Event Log
- Multiple views on common timeline
- Statistics Report
- Memory Heap Utilization
- Communication flow graph
- Queue utilization
- Kernel object history, call intensity and blocking time
- Event labels linked to related views
- User Event Signal Plot
- User Event Log
- Scheduling intensity